Team product (NUWA) · Nov 2023 – Aug 2025
Mora Blog
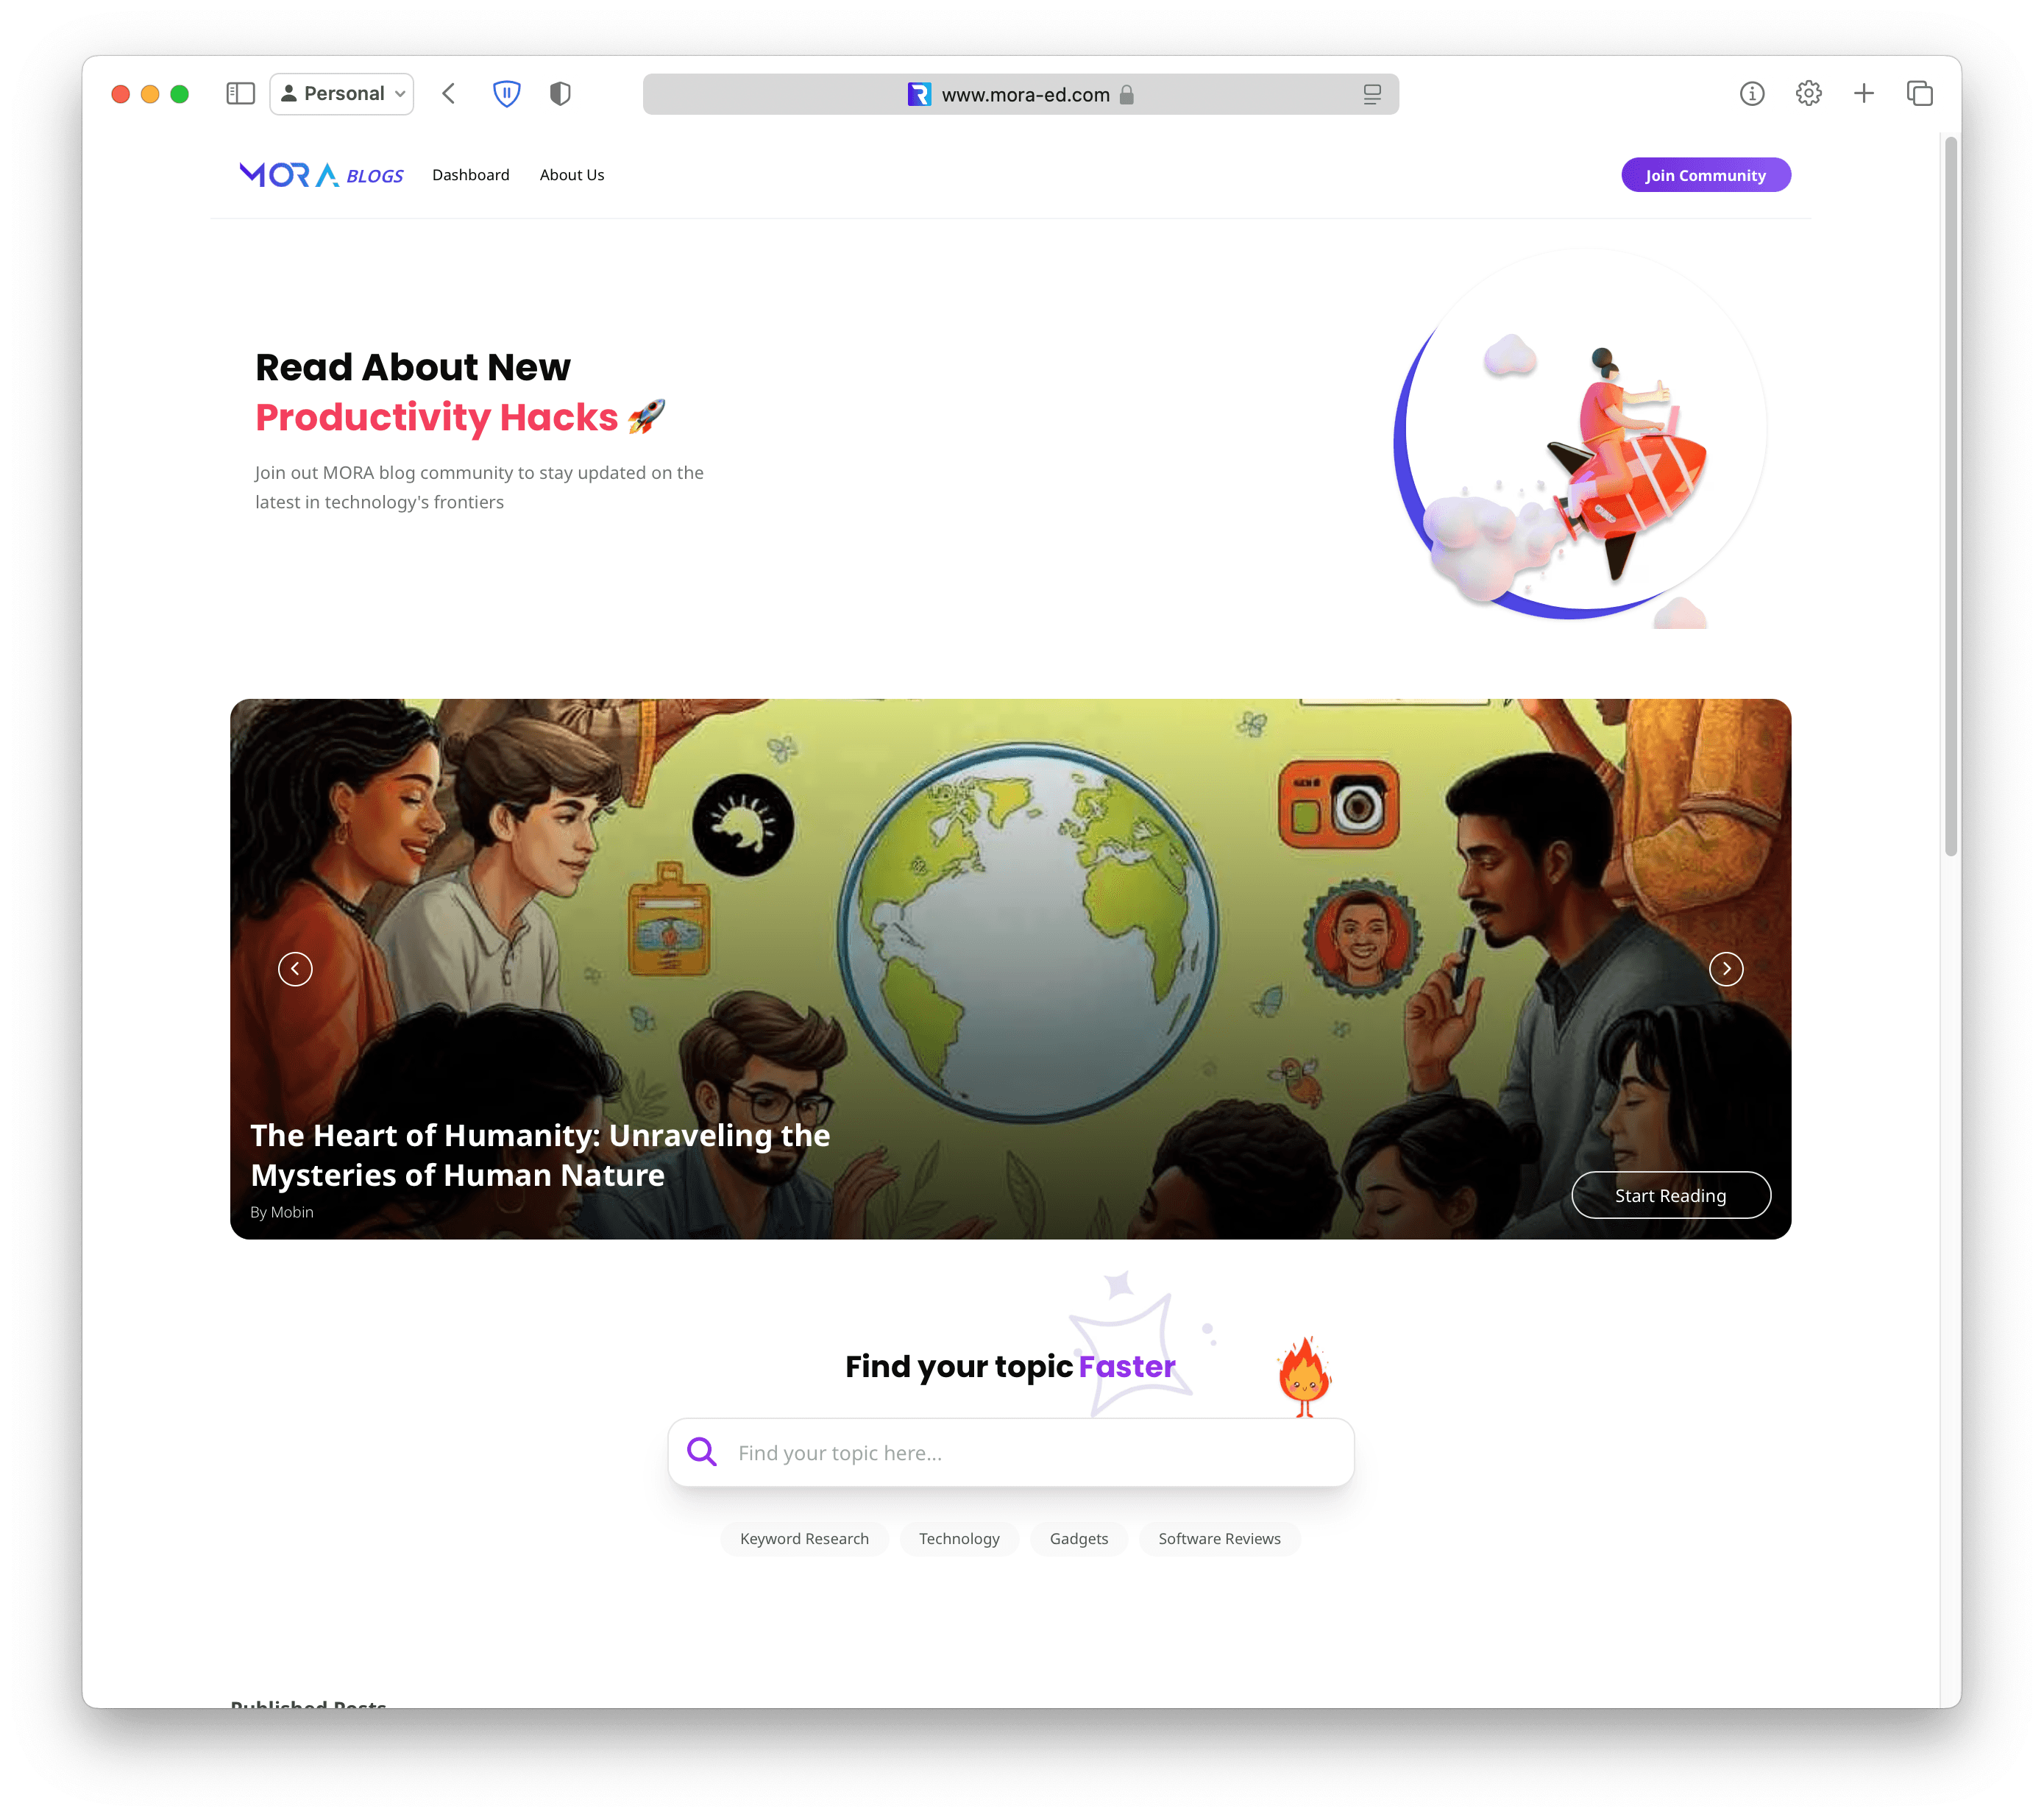
The production blog and content dashboard for Mora, an AI-education platform. My main focus here was performance.
- role
- Full-stack developer
- stack
- Next.jsPrismaS3
No longer live
The problem
The blog has image-heavy pages: hero illustrations, post covers and author images. An early Lighthouse run showed slow loading and visible layout shifts. As a content site, it also depends on good SEO and accessibility scores.
My role
Full-stack developer at NUWA. I built the blog and its content dashboard and did the performance work. The repository has about 460 commits from Nov 2023 to Aug 2025, all of them mine.
I also built a separate internal “website builder” dashboard for Mora, using Next.js, Prisma and NextAuth with Jest and Cypress tests.
Stack
What I did
- Image pipeline: media moved to S3 behind CloudFront, correct
sizeson cards, and blurred placeholders generated withplaiceholder/sharpso images don’t pop in. - Layout stability: skeleton loaders for cards, slideshow and post pages; fixed footer and image-box shifts.
- Less work on first load: partial rendering with Suspense for trending categories, no prefetching for homepage links, and removal of an unneeded tag-manager script and spinner component.
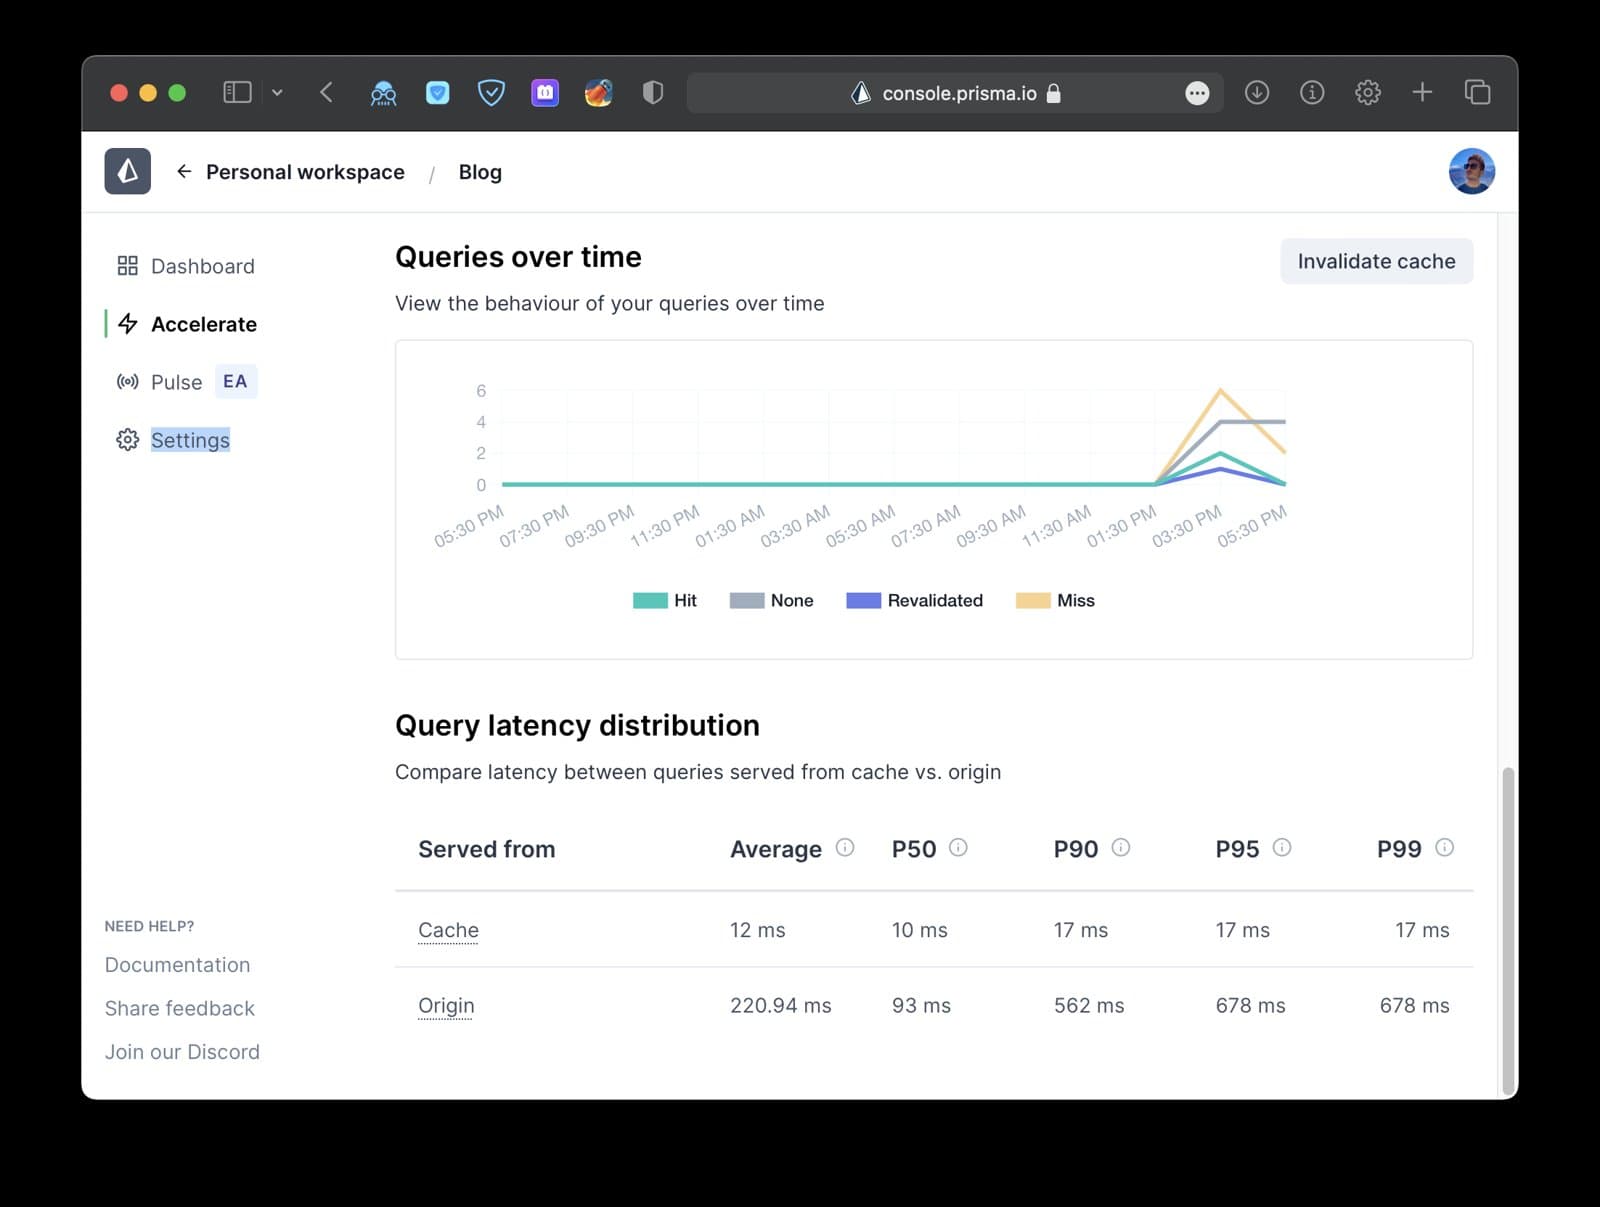
- Database caching with Prisma Accelerate for published-post queries.
- SEO and accessibility: metadata and SEO headers, and fixes to the accessibility issues Lighthouse reported.
- Cypress e2e tests for login, post CRUD and image upload.
Result
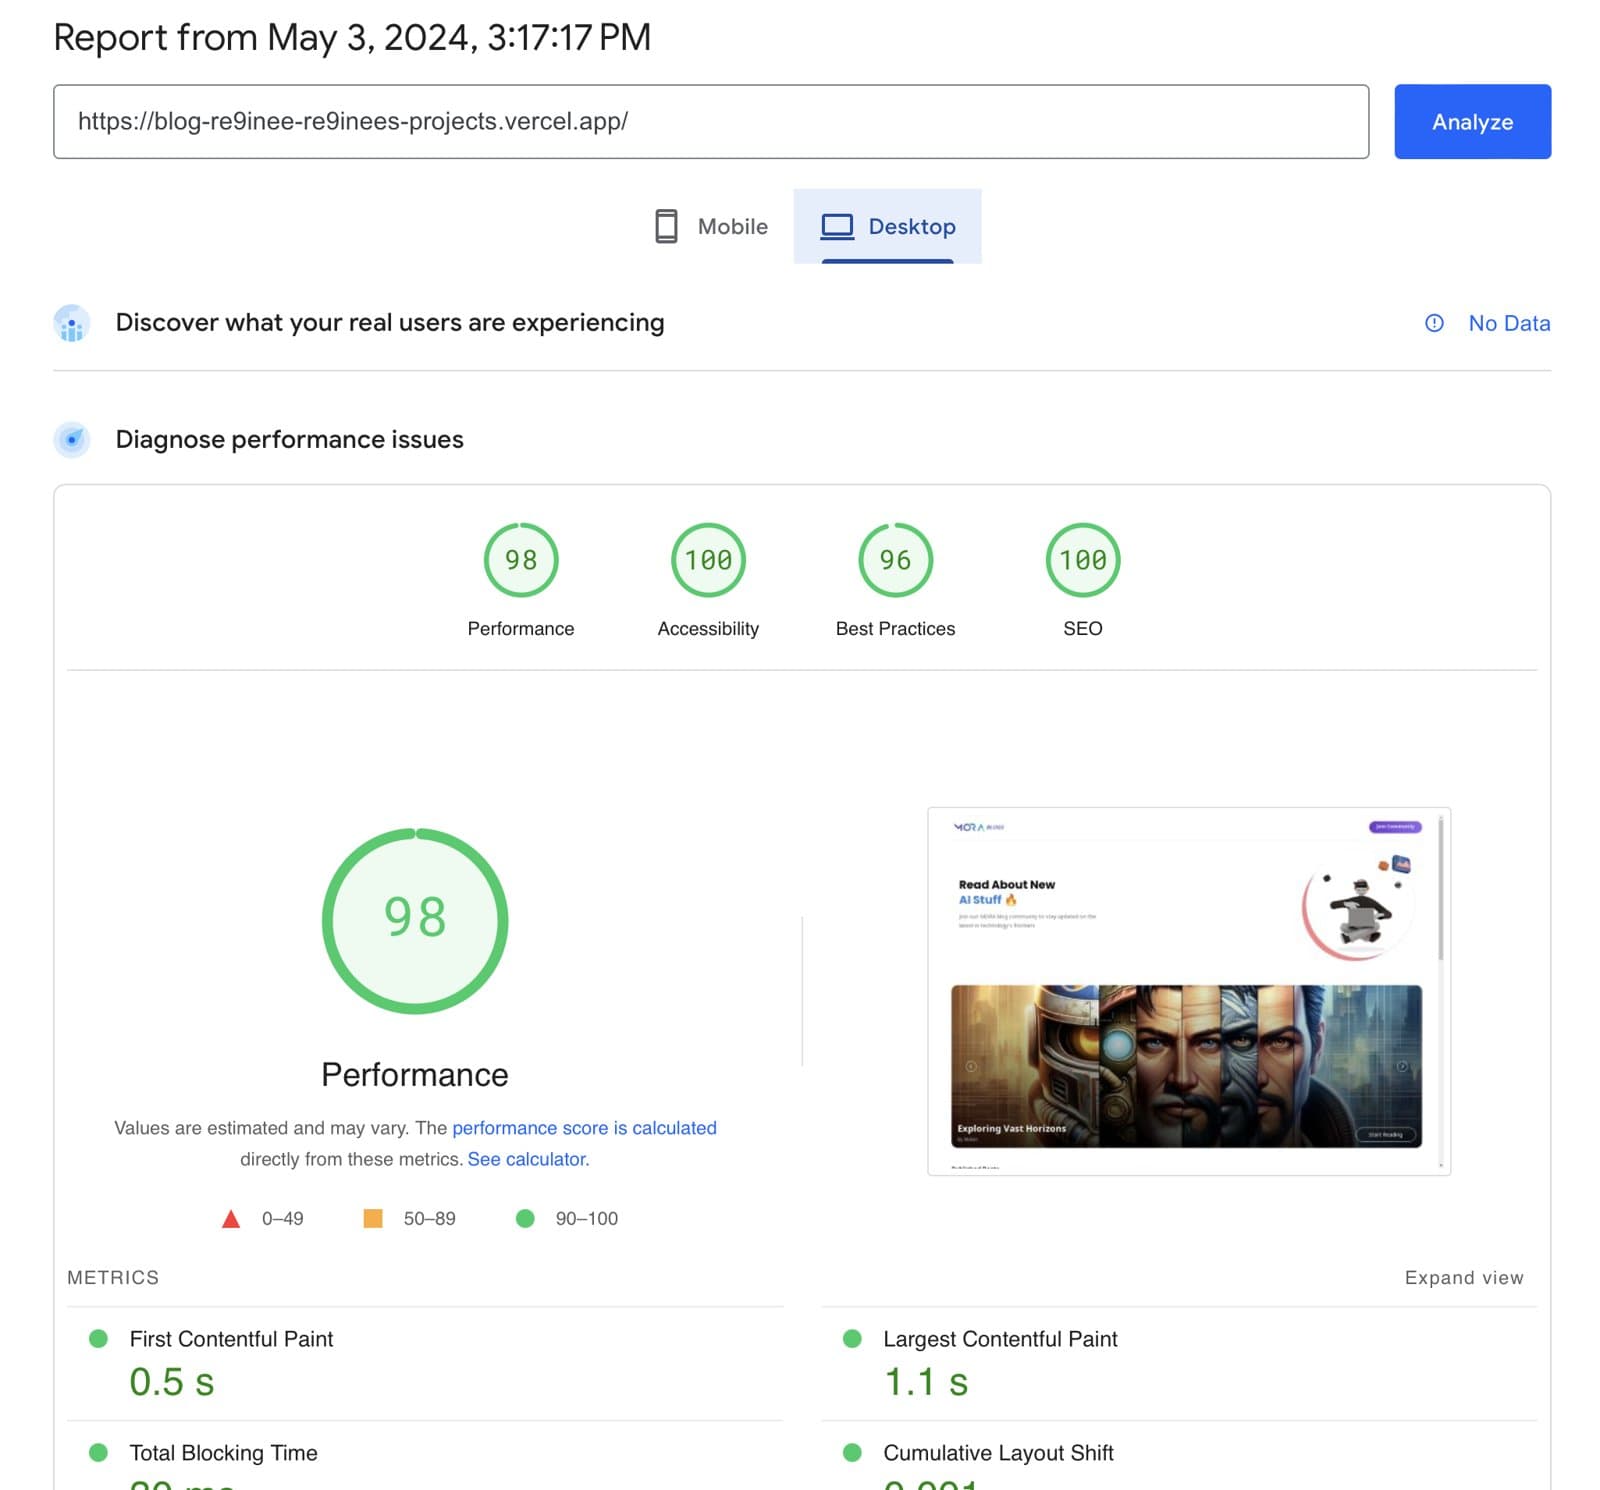
58 → 98Lighthouse performance (desktop)
5.2s → 1.1sLargest Contentful Paint
~220ms → ~11msPublished-post queries with Prisma Accelerate cache
| Desktop Lighthouse | Before (Apr 2024)* | After (May 2024) |
|---|---|---|
| Performance | 58 | 98 |
| Accessibility | 89 | 100 |
| SEO | 80 | 100 |
| Largest Contentful Paint | 5.2 s | 1.1 s |
| Cumulative Layout Shift | 0.312 | ~0.001 |
*The “before” run was a local Lighthouse report, and the “after” run is from PageSpeed Insights on the Vercel deployment. The trend is clear, but the two numbers come from different environments.
Screenshots

What I learned
Most of the improvement came from basic work on images and layout, not from clever tricks.